Broken-Wing Butterflies: Where the Risk Really Goes
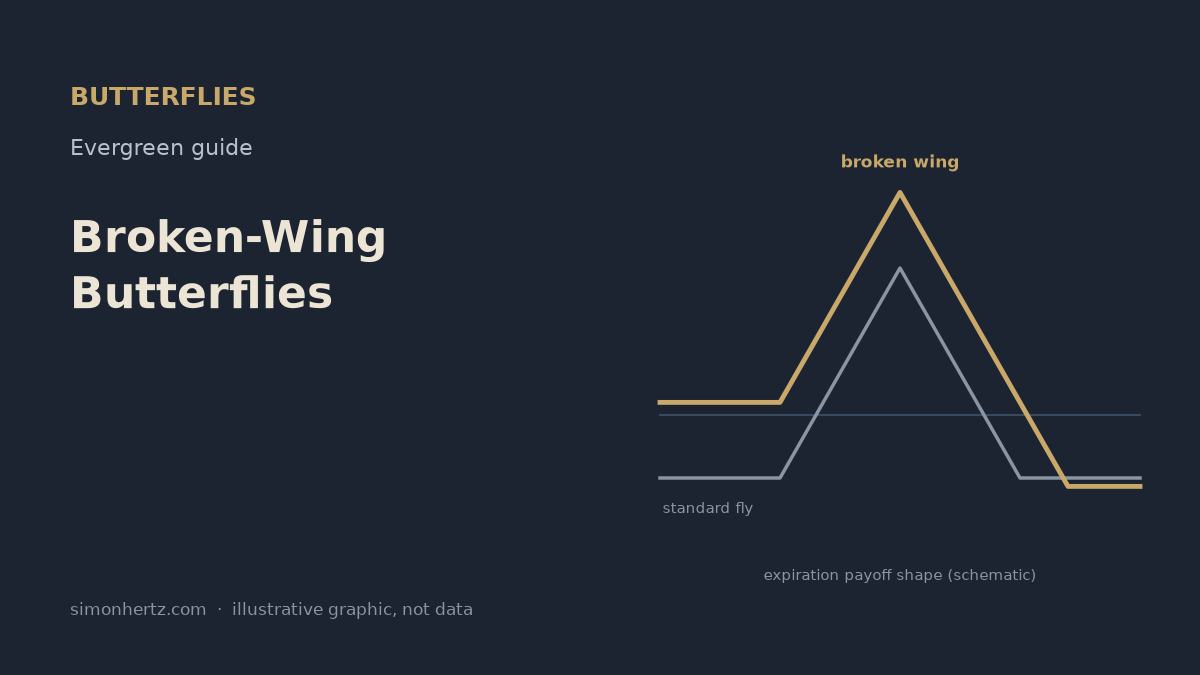
A standard butterfly is a tidy trade: pay a small debit, risk only that debit, and profit if the underlying finishes near the middle strike. A broken-wing butterfly moves one wing farther out. That small change can turn the debit into a credit and remove risk on one side entirely, but it never makes risk disappear. It moves it. This guide shows exactly where it goes, so you can decide whether you want it there.
The rules first
- A broken-wing butterfly is a standard butterfly plus a credit vertical. Skipping a strike on one wing is the same as adding a short vertical spread on that side. Every property of the trade follows from that.
- Max loss on the broken side = (wide wing width minus narrow wing width) minus the net credit, or plus the net debit. Work this out before you look at anything else.
- The risk sits on the side of the wider wing. A call broken-wing fly with the far strike skipped carries its risk above the body; a put version with the far strike skipped carries it below.
- Size by the broken side, not by the credit. A credit up front feels like free money. The number that matters is what you lose if price runs through the wide wing.
- Decide your exit before expiration week. Like any fly, the short body strikes bring pin risk if price closes near them on expiration day.
Start with a standard fly
Take a call butterfly on a stock trading at 100, with every number here an illustrative example, not a quote: buy one 100 call, sell two 105 calls, buy one 110 call. Both wings are 5 points wide. Say it costs a debit of 1.50.
- Maximum loss is the 1.50 debit, if the stock finishes below 100 or above 110.
- Maximum profit is the wing width minus the debit, 5.00 minus 1.50 = 3.50, at exactly 105.
- Breakevens at expiration are 101.50 and 108.50.
The risk is small and symmetric. The catch is that you pay it on both sides, so the stock has to land in a fairly narrow zone for the trade to pay.
Now break a wing
Move the upper long call from 110 to 112: buy one 100 call, sell two 105 calls, buy one 112 call. The lower wing is still 5 points; the upper wing is now 7.
Here is the key decomposition. Compare the legs to the standard fly. The difference is that you no longer own the 110 call and you do own a 112 call. That is the same as taking the original fly and adding a short 110/112 call vertical: sell the 110 call, buy the 112 call. So:
Broken-wing fly (100/105/112) = standard fly (100/105/110) + short 110/112 call vertical.
Suppose, as an example, that short vertical collects 1.80. The fly cost 1.50, so the combined trade opens for a net credit of 0.30. Now read the payoff straight from the two pieces:
- Below 100: every call expires worthless. You keep the 0.30 credit. There is no downside risk at all.
- At 105: the fly pays its full 5.00, the vertical expires worthless, and you keep the credit. Maximum profit is 5.30.
- Above 112: the fly expires worthless and the short vertical loses its full 2.00 width. Net, you lose 2.00 minus the 0.30 credit, or 1.70.
- Upside breakeven: between 105 and 112 the value falls one point for each point the stock rises, and it crosses zero at 110.30.
Compare that with the standard fly. Downside risk went from 1.50 to zero, peak profit went up, and the upside loss went from 1.50 to 1.70. The trade did not get safer. Its risk moved to one side and got slightly larger there.
When the shape makes sense
A broken-wing fly is a directional view with a target. The call version above says: I think the stock drifts up toward 105, I am fine if it falls, and a sharp rally past 110 is the scenario I am willing to pay for. The put version mirrors it: buy a put above the market, sell two lower, and buy a farther put with a skipped strike. That one profits on a drift down to the body, has no risk if the stock rallies, and carries its risk on a sharp drop.
Use the decomposition to check your thinking. If you would not sell that extra credit vertical on its own, at that strike and that size, you should not hide it inside a butterfly either.
Common mistakes
- Calling it risk-free because it opened for a credit. The credit only covers one side. Write down the broken-side loss for every position.
- Breaking the wing in the direction you fear. Put the wide wing on the side you think is least likely, and where a move would come with time to react. Breaking toward known event risk such as earnings is asking for the worst case.
- Widening the wing to chase a bigger credit. Every extra point of width adds a point of max loss. Past a certain width you own a credit spread with a small fly attached.
- Holding into the close on expiration day near the short strikes. If price settles near 105, you cannot be sure how many short calls will be exercised. Close or roll before the last hour rather than guess.
- Ignoring early assignment on the short body. On American-style equity and ETF options, deep in-the-money short calls can be assigned before a dividend. European-style cash-settled index options avoid that particular problem.
A short pre-trade checklist
- Write the trade as a standard fly plus a credit vertical, and name both pieces.
- Calculate the broken-side max loss: wide wing minus narrow wing, minus the credit or plus the debit.
- Size the position so that loss is a number you accept in full. Many brokers hold that amount as the requirement on a defined-risk fly, but check yours.
- Check the calendar for earnings, dividends, and macro events that could push price through the wide wing before expiration.
- Set your profit-taking level and your exit for expiration week before you place the order.
Butterflies get a full treatment in my upcoming book, Trading Butterflies, including broken wings, flies against calendars, and managing pin risk. More on that soon.
All figures in this post are simple illustrative examples, not quotes or market data.
Related reading
- Options Synthetics by Simon Hertz, for breaking spreads into their building blocks, including why an iron fly and a butterfly are the same trade. Available on Amazon.
- Trading Calendars by Simon Hertz, for the other classic way to target a price and a date. Available on Amazon.
- Trading Diagonals by Simon Hertz, available on Amazon.
- All titles: Simon Hertz author page on Amazon.
This post is for education only. It is not investment advice or a recommendation to buy or sell any security or option. Options involve risk and are not suitable for all investors. All numbers above are illustrative examples, not market data.