Nasdaq Plunges 5.28%, VIX Jumps to 35.89: Closing Notes for Friday
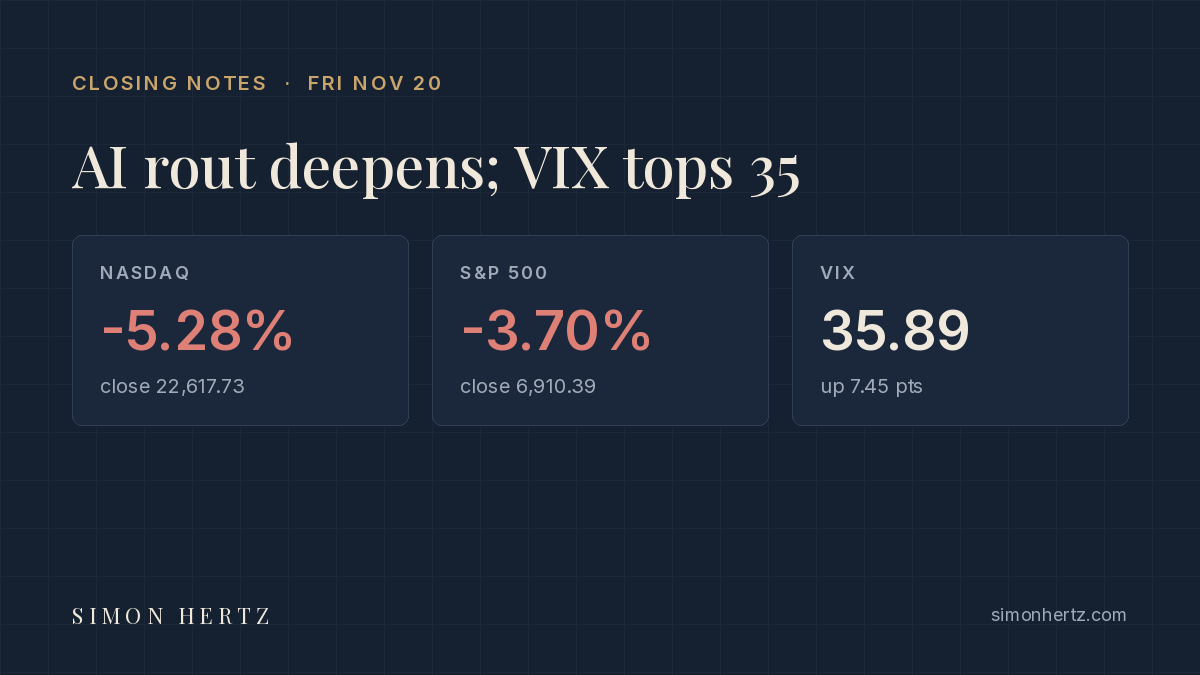
Friday, November 20, 2026: the selling that began after Anthropic’s debut on Thursday turned into a rout. Chipmakers led the decline, the Nasdaq Composite gave up its gain for the year, and both the S&P 500 and the Dow closed 10% below their records, the usual definition of a correction. Money moved into defensive stocks and Treasurys, and the VIX closed at its highest level since late March.
How the session closed
Indexes. The Nasdaq Composite fell 1,261.47 points, or 5.28%, to 22,617.73, leaving it down 2.7% for the year. The S&P 500 dropped 265.44 points, or 3.70%, to 6,910.39. The Dow lost 949.73 points, or 1.93%, to 48,147.33, and the Russell 2000 fell 73.32 points, or 2.76%, to 2,581.79 (CNBC). The Nasdaq-100 slid 5.6% and was 20% below its recent high at its intraday low (CNBC).
The week. The Dow fell 8% on the week, its worst week since March 2020. The S&P 500 lost 8.6%, its worst week since April 2025, and the Nasdaq dropped about 10%, its biggest weekly decline in more than six years (CNBC).
Chips and AI. Nvidia fell about 14% and AMD more than 13%, and Micron dropped almost 14%. Selling in Nvidia picked up after Reuters reported that the Securities and Exchange Commission is looking into possible accounting issues at the company. Anthropic, a day after a 17% gain in its first session, lost 8.5% (CNBC).
Where money went. Defensive names held up: Walmart rose more than 1%, and Costco, Johnson & Johnson and Procter & Gamble each gained about 1% (CNBC).
VIX and MOVE. The VIX closed at 35.89, up 7.45 points or 26.20% (CNBC). The MOVE index of Treasury volatility rose 10.28 points, or 10.70%, to 106.31 (Yahoo Finance).
Treasury yields. Bonds rallied as investors looked for safety. At 5:05 p.m. ET the 2-year yielded 4.649%, down 13 basis points; the 10-year 4.95%, down 10.2 basis points; and the 30-year 5.337%, down 6.4 basis points (CNBC).
Oil. WTI crude settled at $84.09 a barrel, up $0.88 or 1.06% (CNBC).
Data. The University of Michigan’s November consumer sentiment index rose to 51.5, in line with the consensus estimate, as consumers’ inflation expectations eased (CNBC).
What it means for options traders
The realized move doubled the implied one. Thursday’s VIX close of 28.44 implied a daily S&P 500 move of roughly 1.8% on the divide-by-16 shortcut. The index fell 3.70%, about twice that. When the market keeps moving more than options priced, implied volatility gets marked up, and a 26% jump in the VIX in one session is what that repricing looks like.
A volatility level with different rules. With the VIX near 36, a one-standard-deviation daily move on the same shortcut is more than 2%. Strikes that felt far away a week ago are now within a normal day’s range. Short-premium positions sized for a VIX in the teens carry much more risk at these levels, even if the premium collected looks attractive.
Defined risk matters more than direction. In a market where the Nasdaq can fall more than 5% in a day, the maximum loss of a position should be known before it is opened. Vertical spreads cap that loss, and when implied volatility is high, the short leg of the spread helps offset the cost of the expensive long leg.
Weekend risk. Options lose two days of time value over the weekend while the market is closed, and news can arrive before Monday’s open. After a week like this one, gaps at the open are a real possibility, which matters most for positions that depend on the price staying inside a range.
Sources
- CNBC quotes: .SPX, .IXIC, .DJI, .RUT, .VIX, US2Y, US10Y, US30Y, WTI crude (@CL.1).
- CNBC, Stock market news for Nov. 20, 2026.
- Yahoo Finance, MOVE index (^MOVE).
Related reading
- Trading Verticals by Simon Hertz, available on Amazon.
- Trading 0DTE Spreads by Simon Hertz, available on Amazon.
- Trading Iron Condors by Simon Hertz, available on Amazon.
- All titles: Simon Hertz author page on Amazon.
This post is for education only. It is not investment advice or a recommendation to buy or sell any security or option. Options involve risk and are not suitable for all investors. Figures are from the sources listed and may be revised; check primary sources before relying on any number.